One of the cool things about visualisation is that it's abstract. It means we can use the same visual techniques to make sense of very different phenomena. But sometimes it behoves us to know what things are actually 'like'. The Gulf oil spill, for instance: how much is 4.9 million barrels, really? What is 7 billion people like? How big is my carbon footprint? And what's the difference between knowing this as a number and seeing it as a volume of carbon dioxide gas? How curved is the Earth? I want to see the curvature for myself.
This post is a quick attempt to define 'concrete visualisation', which ultimately resorts to 'ostensive definition' (pointing at something and saying: "There. That's it. That's what I mean.") so feel free to scroll down and just look at the pictures. First though, just how curved is the Earth?
Tangent: an animated sketch of a piece of 'land art' that reveals the curvature of the Earth from the ground. The car is travelling at 130 km/h (80 mph) The road is not straight - it curves around surface of the Earth. The line of circles is a straight line - a tangent that touches the Earth's surface at one point. A tangent plane constructed from an array of buoys in a lake is also planned.
The many advantages of abstraction sometimes make it difficult to appreciate the value of 'knowing what something is like'. The ingeneous innovation in data visualisation we've seen in the past decade or so makes it even harder. Nevertheless, the world itself, and our experience of it are very much underused in data visualisation. Abstraction can alienate viewers from the physical reality a visualisation points to, effectively disarming a range of other critical skills that could be applied to ‘make sense’ of the data.
'Concrete visualisation' is an approach to data visualisation that provides quantitative insight physically rather than purely numerically or geometrically. At least that's one definition; since I first started using the term in this way I've come up with dozens. Here are just a few:
- Visualisation that eschews abstraction and instead communicates a sense of physical scale
- Visualisation that co-opts the world itself in its own explanation
- Seeing what something is actually like
- Techniques that draw on more than just our visual experience to make sense of data visually
- Representing data iconically rather than indexically
- Visualisation that's not abstract
There is much of the universe to which we don't have direct access. The big bits, small bits and very numerous bits are particularly inaccessible, though we can understand them in abstract terms. 'Concrete visualisation', whilst much less flexible than regular (abstract) visualisation can give us a different kind of insight. It can extend our perception and give us a 'feel' for otherwise inaccessible phenomena. It is the process of co-opting the world itself and making it part of its own explanation. It fills the gap between, for example, understanding people and understanding populations (a space I explored in a recent commission from the FutureEverything festival).
The truth is, I'm not yet 100% sure what I mean by concrete visualisation, but I'm convinced there's some coherence to the term and it seems to describe a lot of both the art work and graphic design I do. Perhaps an ostensive definition is more appropriate. Here then are three sets of ostensive definitions, and some links to others.
Ostensive definition 1: Concrete visualisation is what we do at Carbon Visuals.
Carbon Visuals is a company that helps people make sense of greenhouse gas emissions, savings and targets and so supports climate change awareness initiatives, behaviour change, carbon management plans, etc. What distinguishes Carbon Visuals from everyone else in the sector is that, in general, we illustrate actual volumes of carbon dioxide gas. Whenever possible, we do this in a way that allows the target audience to draw on their own embodied experience to literally 'make sense' of the quantity. For instace, we use the place that people work to provide a sense of scale.

139 thousand tonnes of carbon dioxide would fill a sphere 521 metres across.
To most Londoners, '139 thousand tonnes of carbon dioxide' is not a very meaningful quantity. Illustrating it in the context of London landmarks allows viewers to make it meaningful for themselves. The illustration is compelling not just because it is visual, but because we can relate to it on a physical level. Londoners - the primary audience - know what it is like to walk across Tower Bridge, or stand near to the BT Tower, and so can 'feel' how big 139 thousand tonnes really is.

A simple carbon dioxide visualisation comparing emissions associated with a low-energy compact flourescent lightbulb (left) and an equivalent incandescent bulb (right). (The calculation uses a UK Government conversion factor for grid electricity.)
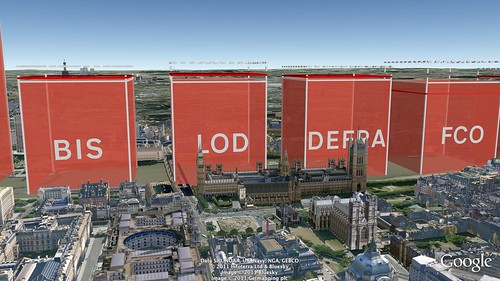
Carbon dioxide emissions (including targets and savings) from UK Government departments. Left to right: Department for Business, Innovation and Skills; Law Officers' Department; Department for Environment, Food and Rural Affairs; Foreign and Commonwealth Office. For more information see: The Carbon Quilt Blog.
A short animation shows global carbon dioxide emissions in real time using the volume o the UN building as a unit of comparison

The volume of one tonne of carbon dioxide gas
One of my more concrete carbon visualisations. This cube in Stoke Newington School, London is 8.12 metres tall and takes up the same volume as 1 tonne of carbon dioxde gas at atmospheric pressure and 15 °C. It is used as a platform by both art and science teachers for projects about climate change.

NOT a concrete visualisation
By way of contrast here is an abstract visualisation. Two bubble maps show the carbon dioxide emitted into the atmosphere by different countries. Left - cumulative emissions since 1751; right - emissions in 2006. The two diagrams are to scale. The colours of the circles indicate membership of the G20. Data source: CDIAC, doi10.3334/CDIAC/00001 There are interactive versions (which show all countries) of each of these bubble maps here:carbonquilt.org/gallery/interactive. The chart is discussed in this blog post: carbonquilt.posterous.com/who-should-pay-for-climate-change.
For many more concrete visualisations of greenhouse gases see Carbon Visuals Work. To make your own visualisations see Carbon Quilt.
Ostensive definition 2: Concrete visualisation is what Chris Jordan does when, with his huge images, he makes large numbers tangible

Left all the water in the world (1.4087 billion cubic kilometres) including sea water, ice, lakes, rivers, ground water, clouds. Right All the air in the atmosphere (5140 trillion tonnes) gathered into a ball at sea-level density.
Just two data points are visualised: 1.4087 billion cubic kilometres of water and 5,140 trillion tonnes of air, which would not warrant graphical representation at all if we were visualising them abstractly. Nevertheless, although the image is impoverished from the point of view of ‘data density’ visualising these data concretely provides a new kind of quantitative insight into the world.

It is interesting to note how and why the image works. It is not just visual familiarity with the globe that provides a sense of scale; it is also viewers’ experience of travel. Being able to relate the diameters of the spheres to journeys one has actually made gives another dimension to viewers’ understanding of the quantities involved. For this reason, I made two additional versions – one centred on North America and one centred on Asia – to help non-Europeans/Africans relate to the image directly (above).

Land-cover Islands
If you collected together all the land that was desert, all the land that was grassland, forest, cropland, etc. and gave each type of land cover an island of its own, this is how those islands could appear. Note how small the 'urban' island is, yet it is home to over 50% of humans. The table is an adequate summary of the data but seeing continent sized islands gives us something that anyone who is familiar with the globe can relate to in a physical as well as numerical way. Data: IIASA
Other ostensive definitions:
- Allotment - sharing the Earth (literally)
- Reality augmented data (turning Augmented Reality on its head)
- Getting a feel for the Deepwater Horizon spill